There is a very interesting language fact in the United States. While (American) English is the dominant language spoken in the country, at the federal level, the U.S. does not have an official language.
Since 1890, the U.S. Census Bureau has been regularly conducting surveys regarding the languages people spoke and how they interact with English speakers and their ability to participate in civic life.
Currently, the primary purpose of the language survey is to calculate the size of the population in the United States that may need help in understanding the country’s main language. The results of the survey are also used in many research, policy and legislative applications. Those people who are not able to speak English “very well” can be helped by translation or interpreting services, providing them with assistance in accessing government services and education. The data sets guide the federal government in determining areas where language assistance services must be provided as required by the Voting Rights Act. The data sets are also used for the allocation of educational funds for schools where English proficiency is low.
Popular languages
Since 1980, the number of people who speak a non-English language in the United States has more than doubled. Based on the report released by the U.S. Census Bureau in 2011, the trend today is towards bilingualism, with some languages making it to the list of the most popular.
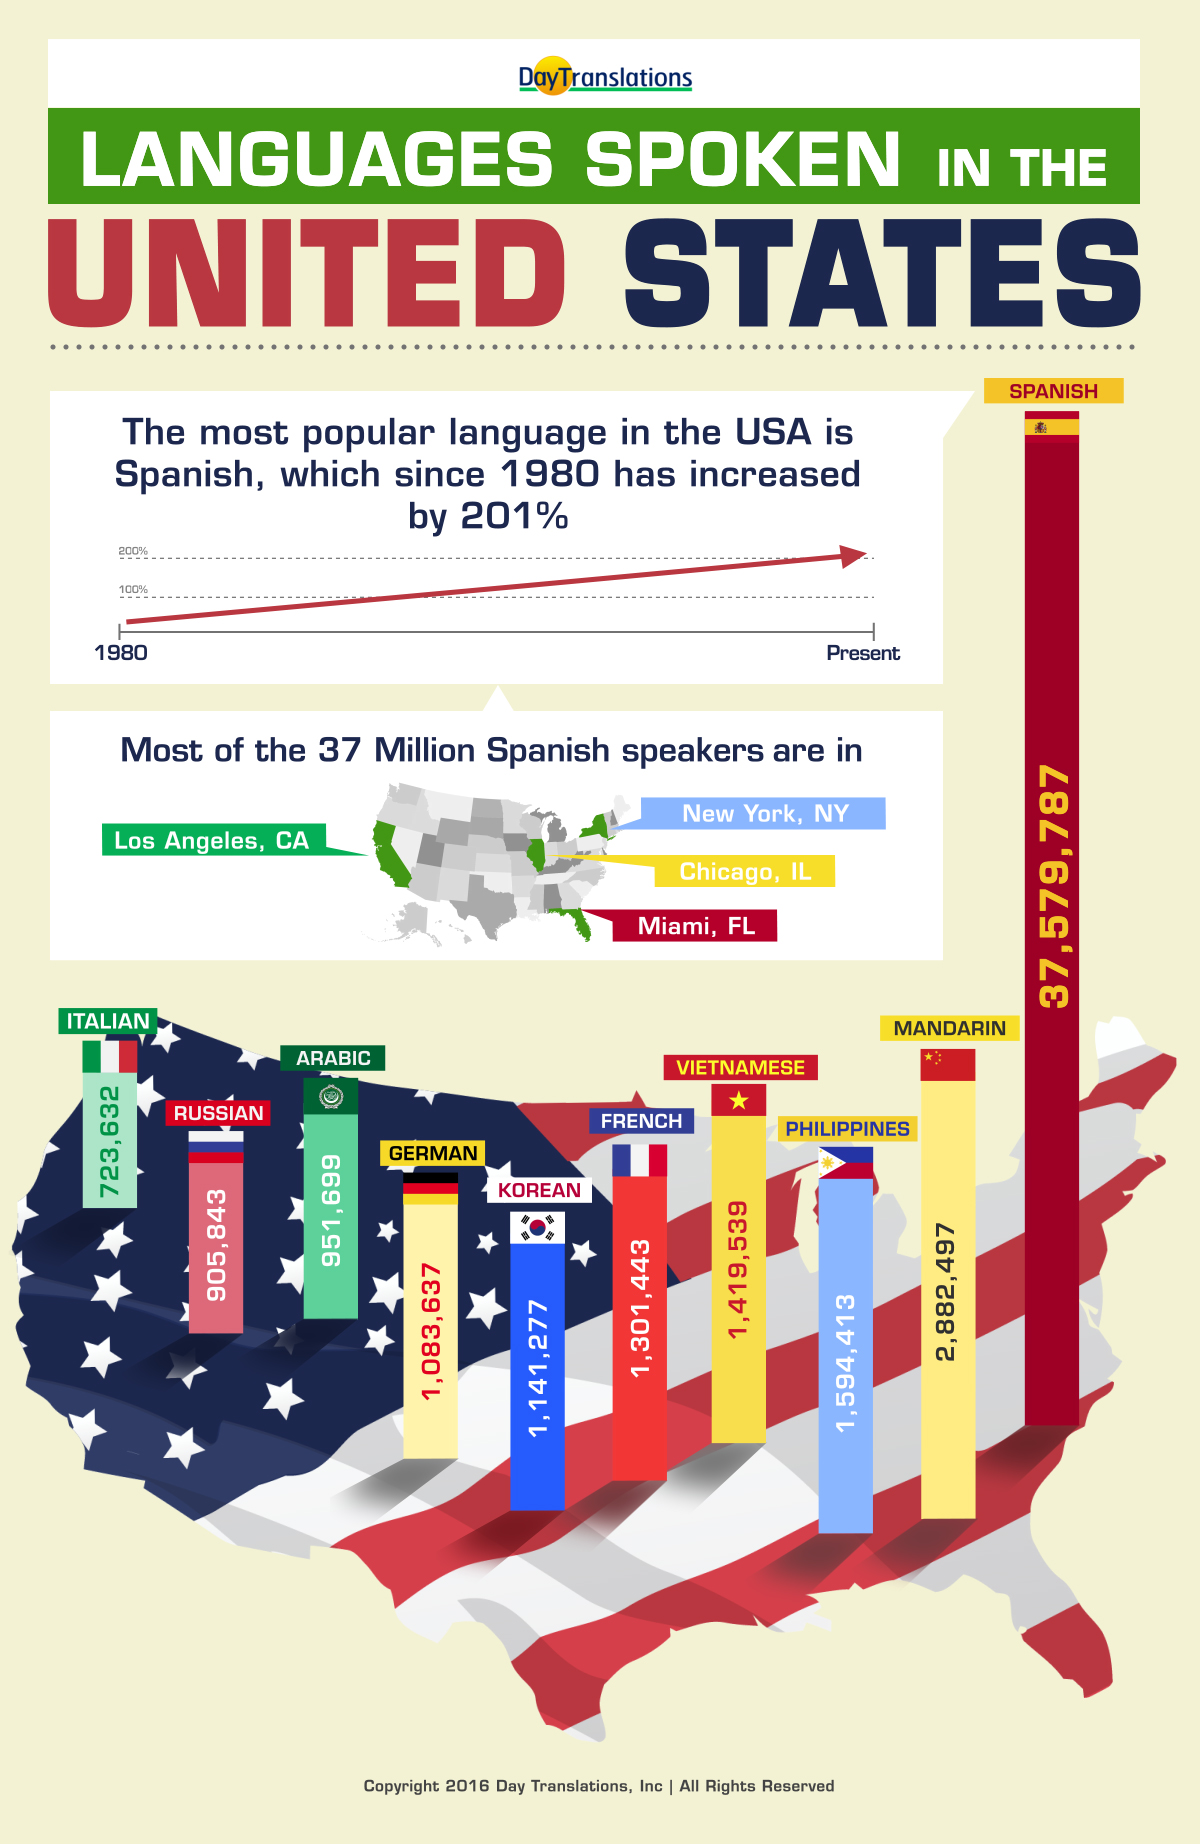
- Italian has suffered the most decline. The number of speakers today, which stands at 723,632 is about half of the number of Italian speakers in 1980. The language is predominantly heard in Philadelphia, Chicago, Boston and New York today.
- In contrast, the number of Russian speakers has increased. There are now 905,843 Russian speakers, most of them found in San Francisco, Chicago, Los Angeles and New York.
- Based on the 1980 record, only 251,409 people in the U.S. speak Arabic. Today, the number has grown much larger, particularly in Dearborn, Michigan. The latest figure on record is 951,699.
- The number of Korean speakers has also increased, especially in Chicago, Washington, D.C., New York and Los Angeles. The last survey recorded 1,141,277.
- Just like Italian, the number of German speakers has suffered a decline. Mainly concentrated in Washington, D.C., Los Angeles, Chicago and New York, there are now 1,083,637 German speakers in the country, from 1,586,593 in 1980.
- While speakers of German went down by 30 percent, the number of French speakers increased by 28 percent from the 1980 figures. There are now 1,301,443 French speakers in the U.S. and most of them are found in Miami, Boston, Washington, D.C, and New York.
- Vietnamese has one of the largest increases since 1980 at 510 percent. Today’s Vietnamese speakers in the U.S. number 1,419,539, and they are mainly located in Dallas, Houston, San Jose and Los Angeles.
- Tagalog or Filipino has 1,594,413 speakers in the U.S. today, with most of them forming large communities in San Diego, New York, San Francisco and Los Angeles.
- The number of Mandarin and Cantonese speakers, mainly found in San Francisco, Los Angeles and New York, has increased by 290 percent and has reached 2,882,497 speakers.
- Still topping the most popular language chart is Spanish, which, since 1980, has increased by 201%. Most of the 37,579,787 speakers of Spanish are in Chicago, Miami, New York and Los Angeles.
Expansively speaking, you can say that Spanish speakers are scattered all over the country and if you are to create a map, Spanish is spoken in all areas except in Louisiana and some states close to the border with Canada where the major language used is French. In Alaska, Yup’ik, a Native American language, ranks second after English, while Filipino is a popular language in Hawaii. There is also a small area in North Dakota where the majority speaks German.
Surprisingly, if you take out Spanish, you are likely to see an interesting trend. You can factor in the cultural, immigration and ethnic patterns. You’ll be able to see where the other languages are spoken. Add into this mix, the top Indigenous languages such as O’odham, Ojubwe, Zuni, Cherokee, Keres, Western Apache, Dakota and Navajo, aside from Central Alaskan Yup’ik. Likewise,
American Sign Language, Hawai’i Sign Language and Plains Indian Sign Language could be added to the list as well.
Major language groups
In the 2011 census report, there were 291.5 million people in the U.S. ages 5 and over. Out of this figure, 60.6 million people or 21% speak a language other than English at home. On the other hand, a total of 231 million only spoke English at home.
The U.S. Bureau of Census records show a total of 381 languages spoken in the country, which can be categorized into four major language groups.
Spanish
- This includes Spanish, Ladino and Spanish Creole.
Other Indo-European languages
- Germanic languages
- German
- Yiddish
- Dutch
- Scandinavian languages
- Swedish
- Norwegian
- Romance languages
- French
- Italian
- Portuguese
- Slavic languages
- Russian
- Polish
- Serbo-Croatian
- Indic languages
- Hindi
- Gujarati
- Punjabi
- Urdu
- Celtic languages
- Greek
- Baltic languages
- Iranian languages
Asian and Pacific Island languages
- Chinese
- Korean
- Japanese
- Vietnamese
- Hmong
- Khmer
- Lao
- Thai
- Filipino (Tagalog)
- Dravidian languages of India
- Telugu
- Tamil
- Malayalam
- Other languages of Asia and Pacific (Polynesian and Micronesian, and other Philippine languages and dialects
All other languages
- Uralic languages
- Hungarian
- Semitic languages
- Arabic
- Hebrew
- African languages
- North American languages
- American Indian and Alaska native languages
- Indigenous languages of South and Central America
Comparing the figures based on a 10-year increment, the decline and rise of languages spoken at home by people 5 years and over are quite remarkable.
| 1980 | 1990 | 2000 | 2010 | |
| POPULATION | 210,247,455 | 230,445,777 | 262,375,152 | 289,215,746 |
| English only | 187,187,145 | 198,600,796 | 215,423,557 | 229,673,650 |
| Other language | 23,060,040 | 31,844,979 | 46,951,595 | 59,542,596 |
English-speaking ability
From the top 10 popular languages, the survey also showed the English-speaking ability of the non-English speakers. German speakers topped the list of people who declared that they spoke English very well, at about 84%, followed by French speakers at 80%. Filipino speakers came next at about 68%; Arabic speakers at 62% and French Creole and Spanish speakers at 58%. About 52% of Russian speakers said they spoke English very well, while it’s 45% for Korean and Chinese speakers. Around 40% of Vietnamese speakers declared that they, too, could speak English very well.
Taking the figures into another context, it can be construed that people who speak Vietnamese, Korean and Chinese are less-proficient when it comes to speaking in English, compared to people who speak Spanish.
Americans speak about 381 languages at home, with some 150 Native American languages included in the list. Some of the other languages included in the total number have only a few speakers, though.
In most of the largest cities in the U.S., it was noted that English has become a minority language, particularly in cities such as Washington, D.C., Houston, New York, San Francisco, Miami and Los Angeles.
The survey results are indicative of how linguistically and culturally diverse the United States has become.